Getting started with Google Analytics Reporting API (V4) and Python
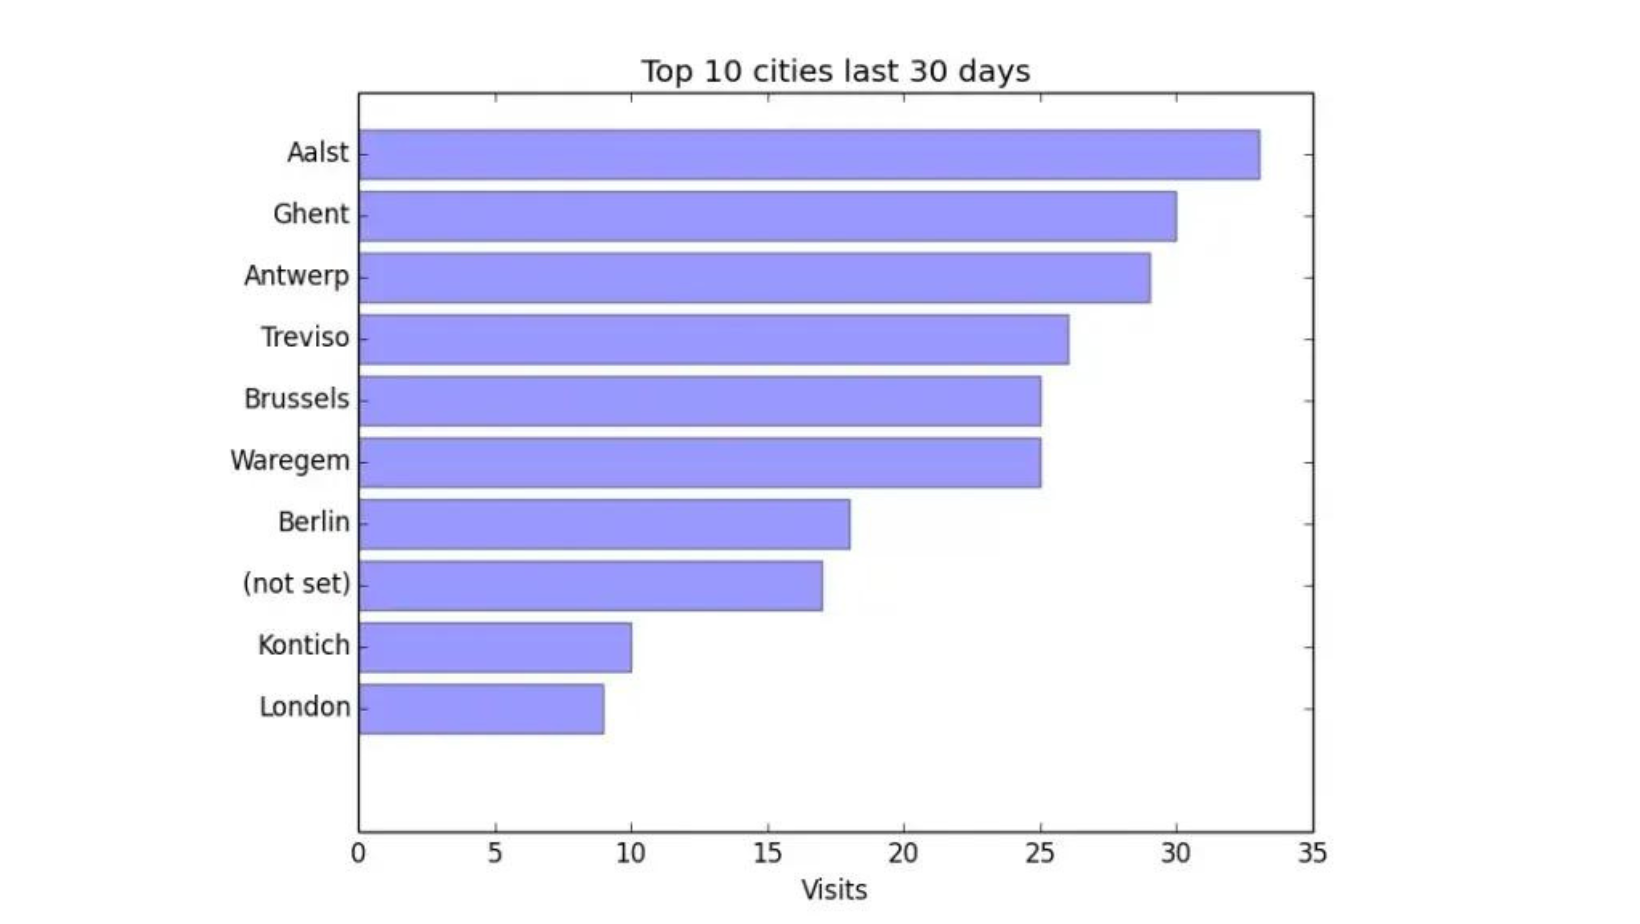
Ever wanted to do something with the Google Analytics Reporting API but didn’t really know how to begin? In this article I’ll introduce you on how to get started with Python and the Google Analytics Reporting API V4. You’ll learn how to create a report using the API and create an awesome looking graph (top cities / visit) like this:

Before we start
There’s a couple of things I want to mention before we start. Obviously, if you have zero coding/scripting experience, this tutorial is not for you. You’re expected to have some coding knowledge as I will not be explaining every single line of code. If you’re new to Python and would like to start learning I can recommend this excellent beginners class at Codecademy.
This tutorial was developed for Python 2.7 and coded in PyCharm. I expect this to work with other versions and you’re free to use any editor you choose but there’s no guarantees. Just sayin’ ?
Creating a Google Service account
To get started using the Google Analytics Reporting API you’ll first need to create a project in the Google API console. You can use this setup tool which guides you through the process. You’ll need to enable the correct API (reporting API V4) and create your credentials.
On the credentials page click create credentials and select Service account key. Create a JSON key and download it to your computer. You’ve now successfully created a service account which can be used to authenticate with the Reporting API.
Lastly, log in to Google Analytics, select the account you plan to use for this tutorial and in the admin section open up User Management on account level. Now, open your JSON key file you just downloaded in your favourite text editor and copy the client_email. Give this email address read permissions and you’re all set up.
Installing required libraries
First we need to install some Python libraries: the Google API Python client to connect with the API, numpy to do some data tinkering and matplotlib to create a nice looking graph.
You can either use pip or setuptools to install the Google API Python client. For detailed installation instructions visit this page over at Google. numpy and matplotlib are both part of the SciPy stack.
The easiest way to install the SciPy stack is by downloading one of the scientific Python distributions. Visit scipy.org to download and install one of these distributions.
Now fire up your Python IDE and import the required libraries:
from oauth2client.service_account import ServiceAccountCredentials
from apiclient.discovery import build

import httplib2
import matplotlib.pyplot as plt
import numpy as np
Reporting API authorization
Next we need to authorise ourselves and create a service object we can use to request Google Analytics data:
#create service credentials
#this is where you'll need your json key
#replace "keys/key.json" with the path to your own json key
credentials = ServiceAccountCredentials.from_json_keyfile_name('keys/key.json', ['https://www.googleapis.com/auth/analytics.readonly'])

# create a service object you'll later on to create reports
http = credentials.authorize(httplib2.Http())
service = build('analytics', 'v4', http=http, discoveryServiceUrl=('https://analyticsreporting.googleapis.com/$discovery/rest'))
Creating a report
If you’ve ever worked with previous versions of the Reporting API
you’ll notice that with V4 creating a report works quite differently. We
now need to create a ReportRequest object, whereas before we needed to
create a query string.
response = service.reports().batchGet(
    body={
        'reportRequests': [
            {
                'viewId': '88469464',
                'dateRanges': [{'startDate': '30daysAgo', 'endDate': 'today'}],
                'metrics': [{'expression': 'ga:sessions'}],
                'dimensions': [{"name": "ga:city"}],
                'orderBys': [{"fieldName": "ga:sessions", "sortOrder": "DESCENDING"}],
                'pageSize': 10
            }]
    }
).execute()
Parsing report data
The following code parses the response and is pulled straight from the Reporting API documentation. Go have a look if you want to learn more about the request and response format.
#create two empty lists that will hold our city and visits data
cities = []
val = []

#read the response and extract the data we need
for report in response.get('reports', []):

    columnHeader = report.get('columnHeader', {})
    dimensionHeaders = columnHeader.get('dimensions', [])
    metricHeaders = columnHeader.get('metricHeader', {}).get('metricHeaderEntries', [])
    rows = report.get('data', {}).get('rows', [])

    for row in rows:

        dimensions = row.get('dimensions', [])
        dateRangeValues = row.get('metrics', [])

        for header, dimension in zip(dimensionHeaders, dimensions):
            cities.append(dimension)

        for i, values in enumerate(dateRangeValues):
            for metricHeader, value in zip(metricHeaders, values.get('values')):
                val.append(int(value))
Creating a graph with matplotlib
Now all that’s left is to render the response as a nice graph with
matplotlib. And if you’re feeling inspired and want to try something
different, matplotlib.org is chock full of examples.
#reverse the order of the data to create a nicer looking graph
val.reverse()
cities.reverse()

#create a horizontal bar chart
plt.barh(np.arange(len(cities)), val, align='center', alpha=0.4)
plt.yticks(np.arange(len(cities)), cities)

#add some context
plt.xlabel('Visits')
plt.title('Top 10 cities last 30 days')

#render the damn thing!
plt.show()
Now run and behold!
